MARKET INTELLIGENCE

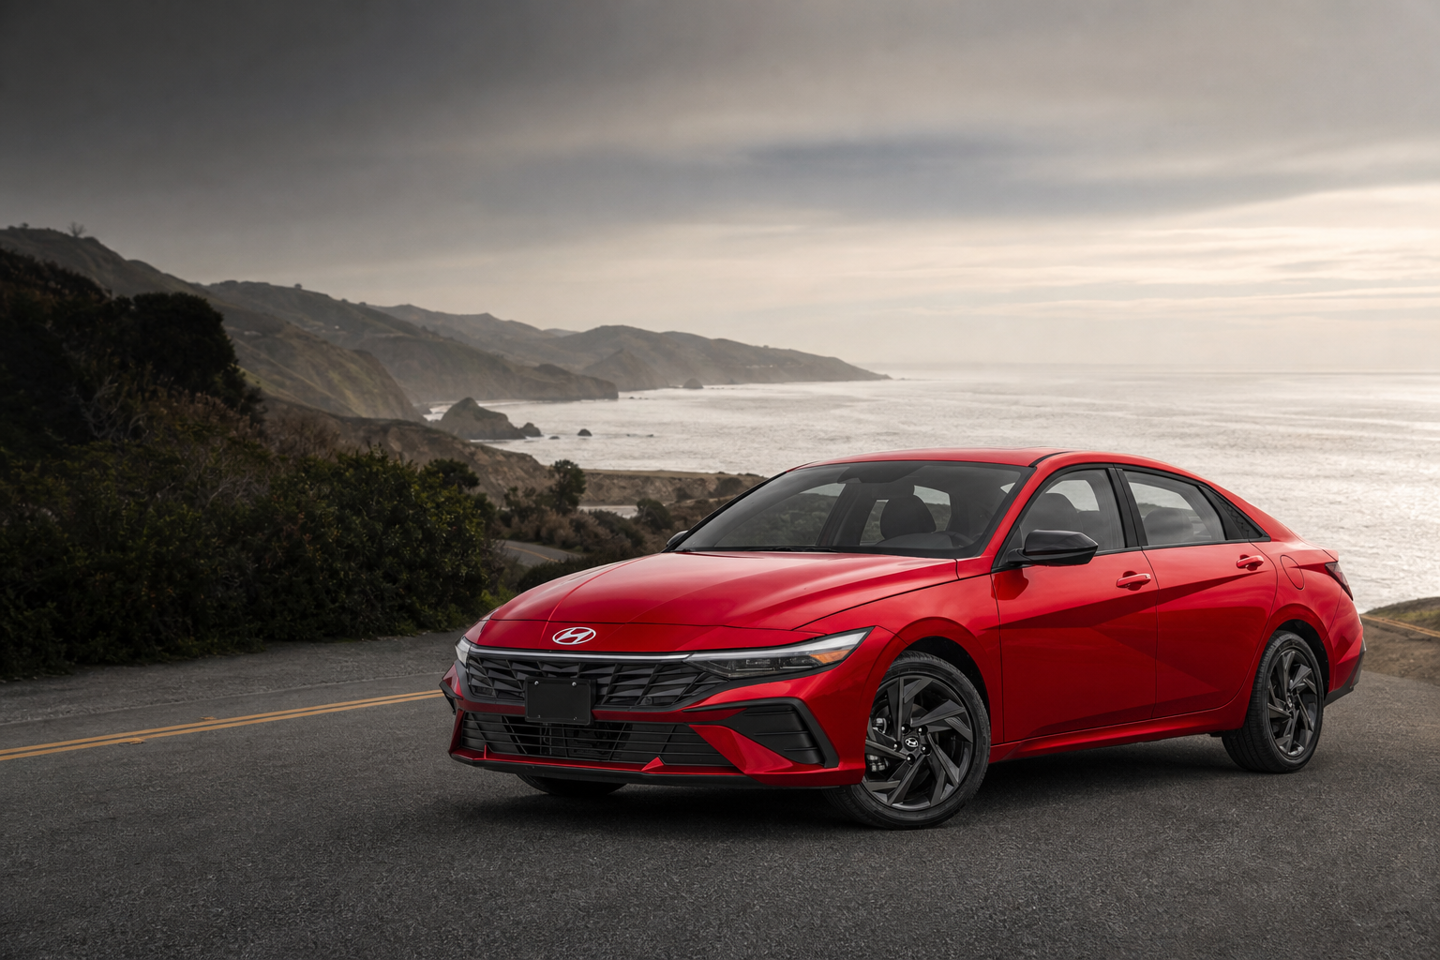
2026 Hyundai Elantra Market Intelligence

Independent Elantra market data — price, inventory, demand, and timing — refreshed daily from our dealer-listings sample, from the national market down to your state and trim.
Reporting period: October 2026Condition: NewUpdated Nov 8, 2026 at 10:05 AM EST

Hyundai Elantra
47
States covered
519
Elantra reports
15
Market metrics
Daily refresh
Latest successful market snapshot

For buyers

Why market data matters

Know a fair price
Advertised and typical prices show what a good deal looks like before you're at the dealership.
See what's available
Inventory and trim mix show how much choice — and negotiating room — you actually have.
Read demand and timing
How fast Elantras sell tells you whether to move quickly or take your time.
Local vs. national
National averages hide local gaps; this shows the Elantra market in your state.

Featured

Featured State Reports

Elantra market conditions vary widely by state. Each report covers price, inventory, demand, and timing for a single state — here are a few worth a look this month.

Map of Washington Longest-sitting listings Washington Median asking price$23,762 Observed listings166 Market temperatureBalanced market Data sourceDealer sample Available supply is roughly in line with how quickly vehicles have been leaving this market. Negotiating conditions are less strongly tilted either way. New Elantra listings observed in our dealer sample — not a count of every vehicle for sale in the state. Map of Oregon Lowest median asking price Oregon Median asking price$23,714 Observed listings113 Market temperatureCool market Data sourceDealer sample Available supply is ample relative to how quickly vehicles have been leaving this market. Buyers may have more room to negotiate. New Elantra listings observed in our dealer sample — not a count of every vehicle for sale in the state. Map of Texas Most observed listings Texas Median asking price$24,559 Observed listings3,069 Market temperatureBalanced market Data sourceDealer sample Available supply is roughly in line with how quickly vehicles have been leaving this market. Negotiating conditions are less strongly tilted either way. New Elantra listings observed in our dealer sample — not a count of every vehicle for sale in the state. Map of North Dakota Youngest listings North Dakota Median asking price$24,684 Observed listings5 Market temperatureLimited market data Data sourceDealer sample There isn't enough state-level supply and sales data to publish a market temperature this month. New Elantra listings observed in our dealer sample — not a count of every vehicle for sale in the state.

View All State Reports

Sponsored

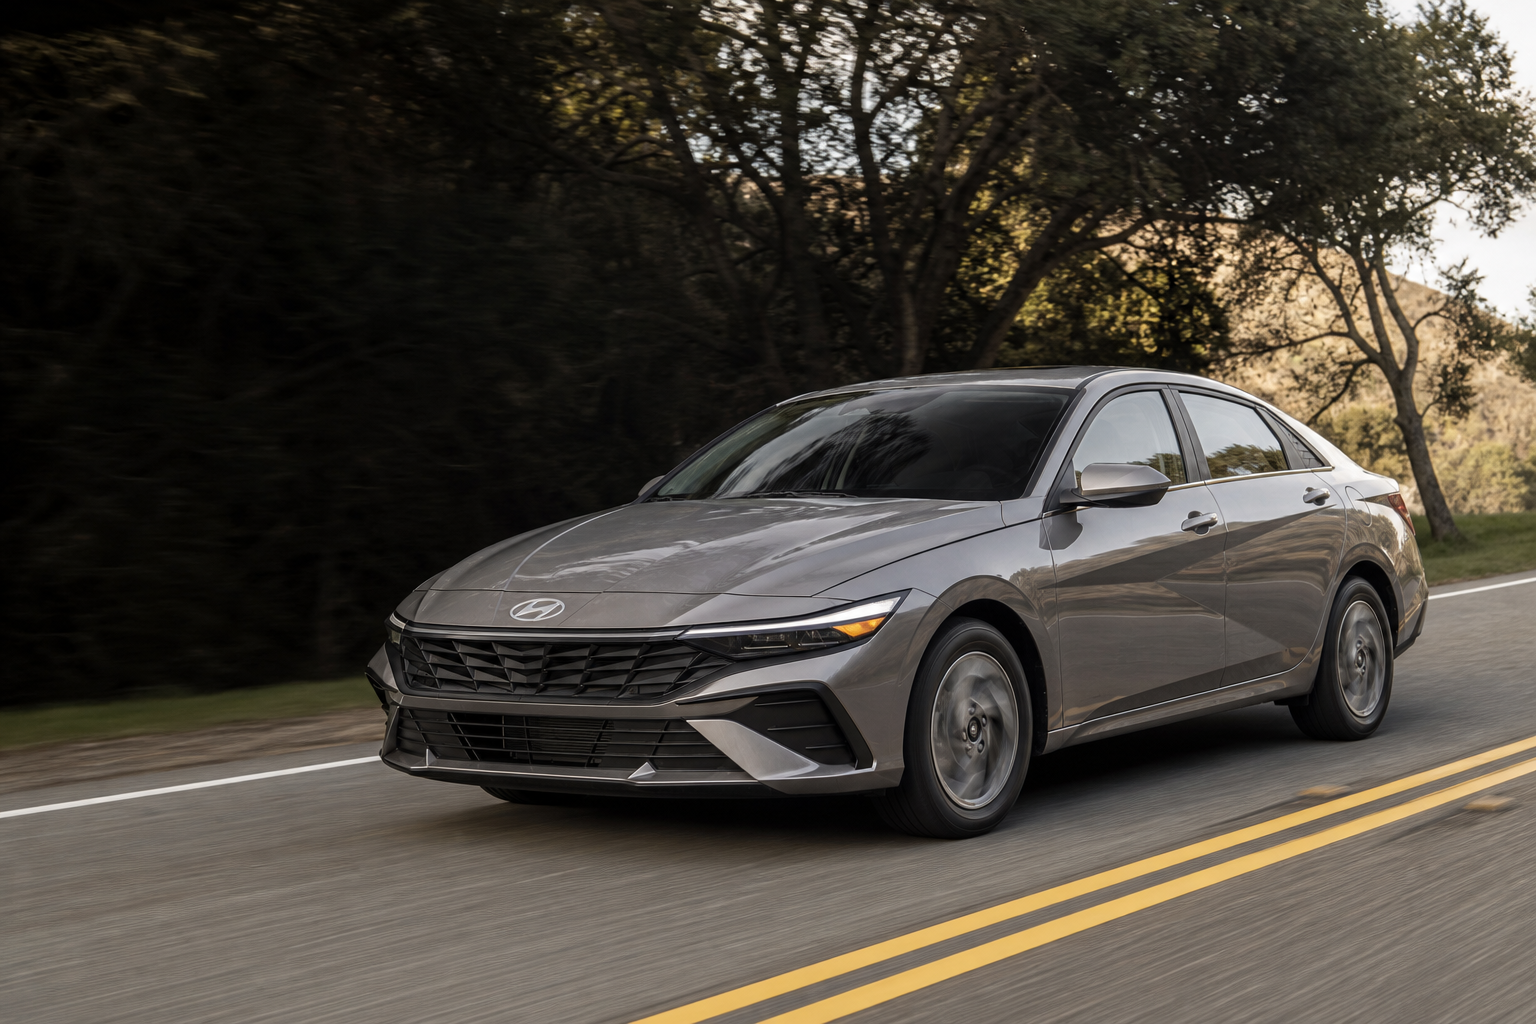
Get Invoice Price on a new Elantra

See what the Dealer Paid and get the BEST Price

Get Invoice Price
This month

Market Signals

Notable, data-backed changes in the Elantra market for October 2026.

Inventory movement
Texas has the most observed Elantra listings in our dealer sample
3,069 new Elantra listings observed in Texas — more selection among the dealers we track.
October 2026

See the report →

Selling speed
Elantras are averaging about 81 days on market nationally
Average days on market across 25,181 new listings observed in our dealer sample.
October 2026

See the report →

Coverage
Some states have limited Elantra data this month
Vermont has only 4 observed listings — below our reporting threshold, so its figures are shown as limited.
October 2026

See the report →

Trust

About our data & methodology

Our Elantra market reports draw on a licensed dealer-listings sample of new vehicles. Listing figures refresh daily; sold-price and sales-volume figures cover the prior completed calendar month. The sample may not represent every vehicle for sale in a state. Every value is labeled Observed or Estimated, and any number below our sample threshold is withheld rather than guessed.

Refreshed monthly
Every report covers the prior completed calendar month (October 2026).
Scope on every figure
Every number names its universe: new listings observed in our dealer sample.
Observed vs. Estimated
Modeled values are labeled and never shown as measured.
Withheld, not guessed
Below-threshold samples are shown as limited, never invented.
Reporting period
The prior completed calendar month (October 2026).
Dealer sample
Figures reflect new-vehicle listings observed in our licensed dealer data; low-sample values are withheld, not guessed.
Observed vs. Estimated
Measured values are labeled Observed; modeled values are labeled Estimated — never shown as measured.
Suppression
Below-threshold samples are withheld and shown as limited, never guessed.